
Vintage Bundles talk at Magnolia JS
What are some strategies for serving modern JavaScript to modern browsers?
A smarter way to break down loading speed problems, identify causes, and implement optimizations

Have you ever been confronted with the daunting task of figuring out what exactly is causing a page to load slowly? Each page can suffer from hundreds of potential issues when it comes to page loading speed. Maybe you’ve experienced this first-hand with an endlessly long Lighthouse audit. No one wants to try optimizing 10 different things to find out that none of them worked.
I am here to tell you that there is a better way. We can use real-user monitoring (RUM) data to provide directional clues that narrow down the possibilities. We work with Shopify merchants and theme developers on a daily basis and have seen the most common issues with Shopify sites.
In this article, I describe how to use this technique to analyze your RUM data. Then, I’ll provide you with a list of some of the most common speed issues for Shopify sites, broken down by those “directional clues”.
Spend more of your time understanding the first section which discusses the RUM analysis technique. Then, use the “common causes” section of this article as a reference after you identify your RUM problem areas. On wider screens, you should be able to see a quick navigation menu to the right.
Before we get started, let’s review the metrics…
The loading speed of a website is measured using three primary metrics, including Time to First Byte (TTFB), First Contentful Paint (FCP), and Largest Contentful Paint (LCP):
Since they all have the same starting point, you can visualize their timing like this:
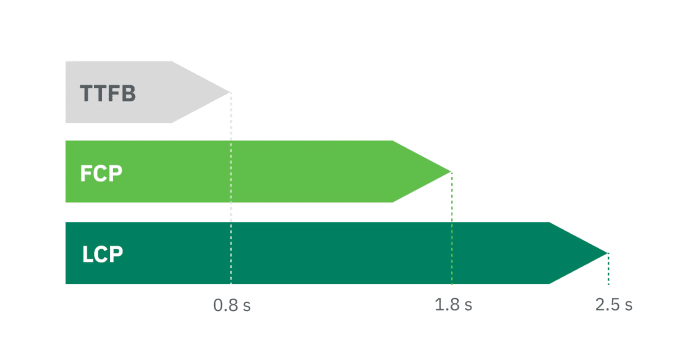
LCP is one of the Core Web Vitals and has the biggest impact on user experience, with FCP at a close second. However, we still measure TTFB and FCP because they make up important parts of LCP and thus can help us understand better where things might be going wrong.
By looking at which metrics are failing the most or where the biggest performance “gaps” lie between them, we can more easily narrow down the potential causes. We like to call these “directional clues”. For example:
Let’s take a look at how these might look with RUM data. In the following visual examples, I’m using screenshots from the free TREO sitespeed tool which uses the Chrome User Experience Report (CrUX) API public data set.
When it comes to your site’s performance, not every page is the same! Ideally, you’d use your own analytics data and evaluate each page type (home, product, collection, etc.) and mobile vs desktop separately to narrow down your clues even further.
Before you can compare yourself, you have to know what good looks like. This merchant performs excellently in all three page speed metrics:

In this example, we see TTFB is excellent, well within the “good” threshold of 0.8s. However, there is a 4.3 second gap until FCP. LCP is technically also poor, but it happens only 0.3 seconds after FCP indicating that FCP is the primary problem for this merchant.

Unfortunately, sometimes you can have multiple problems. In this case, TTFB is fast, FCP is somewhat slow, and LCP is poor. In this case I would optimize FCP first, then LCP though I’d still look for any obvious LCP issues early, like a lazy-loaded image.

In this case, we’re back to an easier issue to sort out. Both TTFB and FCP are good. Only LCP needs to be optimized.

Up until this point, I’ve shown you all real examples from Shopify stores. However, when it comes to TTFB, it’s rare to come across a Shopify store with a very bad TTFB. Contrary to some beliefs, Liquid storefronts are very fast. However, if you are in the rare spot where you do have poor TTFB but the gaps before FCP and LCP are good, it might look something like this:

Now that you’ve identified the gaps for your site, what do you do next? In the following sections, I go over the common causes for slow performance on Shopify for each of the three loading speed metrics. These are not the only possible problems, just the most common ones. If you’re not on Shopify or have your own headless implementation, then unfortunately the list is longer.
Here is a summary of the the most common issues by gap metric which are detailed in the following sections:
TTFB issues
FCP issues
Liquid is the templating language used on Shopify, and our engineers are constantly improving Liquid rendering performance on our backend. However, a few problems can trip you up.
Complex liquid code from nested loops (loops within loops) or calling more data than you need can make Liquid rendering slow. In one edge case, I saw a merchant overuse product metadata with hundreds of checks on the product page for those metadata properties.
What it looks like:

This complexity can be inadvertent. You may be calling data that you do not need. In those cases, you can simplify the code and recover the performance.
In the cases where you need the complexity, you may want to re-architect the solution. For example, if you have a mega menu that requires complex Liquid and loops, you might consider rendering what's visible right away with Liquid and then using minimal JavaScript to fetch the rest of the data asynchronously. This would preserve the user’s perception of speed.
In any case, use the Theme Inspector to determine if Liquid is your problem and how exactly it is rendering.
Other than Liquid complexity, achieving good TTFB is out of your control. Shopify has a dedicated team working on server optimizations and making Liquid faster, making it best-in-class for server performance. However, sometimes things go wrong. If your TTFB performance has dropped recently along with several other Shopify sites, then this might be the issue. These events are rare and usually recover quickly.
As a browser parses HTML, it pauses when it encounters a link to a CSS or synchronous JavaScript file. The browser must then download these files before it can continue rendering the rest of the page.
What it looks like:
When running Lighthouse or PageSpeed Insights, you will get a failed audit that looks like this:
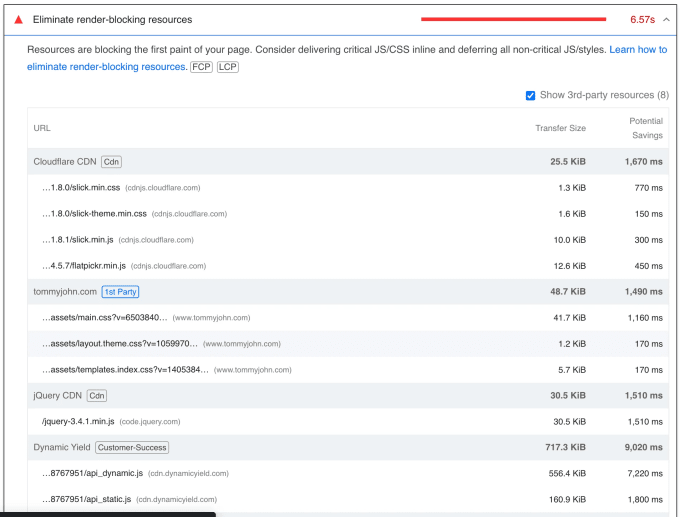
The goal isn't to eliminate all render-blocking resources. For instance, CSS that styles content above the fold should be render-blocking. This prevents layout shifts or flashes of unstyled content.
On the other hand, JavaScript files, unless they are needed for rendering (such as in an A/B test or when using JavaScript to render the page with React or Vue), should often be deferred.
Anti-flicker snippets are used to prevent a flash of unstyled content (FOUC) or a flash of original content (FOOC) when running A/B tests. They forcibly hide the page until some trigger point defined in JavaScript. However, forcibly hiding the page impacts performance so it’s a pretty big tradeoff. Andy Davies covers these tradeoffs and some options in his post The Case Against Anti-Flicker Snippets.
What it looks like:
Anti-flicker snippets can be tricky to find. Your first clue will be that FCP does not occur until well after the HTML and CSS downloads, which are lines 1-2 in the following waterfall. At this point, I usually suspect an anti-flicker snippet by looking for familiar script names. Here, the scripts from www.googleoptimize.com and dev.visualwebsi…izer.com were a clue that VWO (an A/B testing provider) was used. Then I tested disabling that script to validate that the FCP would occur faster.
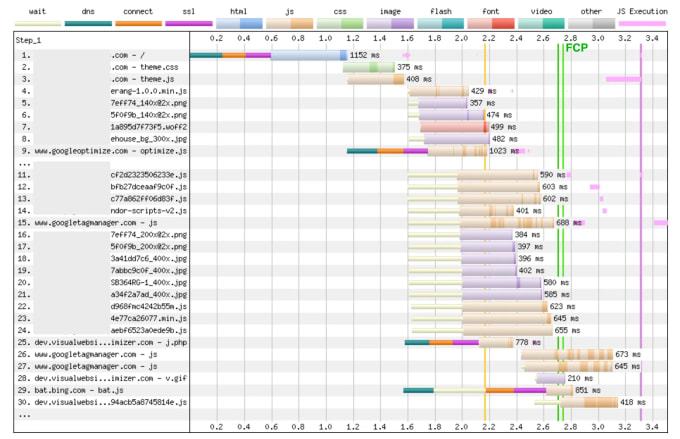
If you use A/B testing, remember to close out tests once they are complete and ensure your testing app disables the anti-flicker snippet when no tests are running. If you customized your theme to add a third-party A/B testing library, you can encapsulate the script in a Liquid if statement that checks a theme setting toggle that completely removes the code when no testing is desired:
In config/settings_schema.json:
{
 "name": "Third parties",
 "settings": [
   {
     "type": "checkbox",
     "id": "enable_vwo",
     "label": "Enable VWO Async SmartCode (for A/B testing)",
     "default": false
   }
 ]
},
In layout/theme.liquid:
{% if settings.enable_vwo %}
 <!-- script for 3rd-party A/B testing provider like the VWO Async SmartCode -->
{% endif %}When a browser fetches resources like CSS, JavaScript, or images from different domains, it has to establish new connections. Each of these connections involves a DNS lookup, initial connection, and SSL negotiation before content can finally download. This added time can significantly slow down the FCP and LCP.
What it looks like:
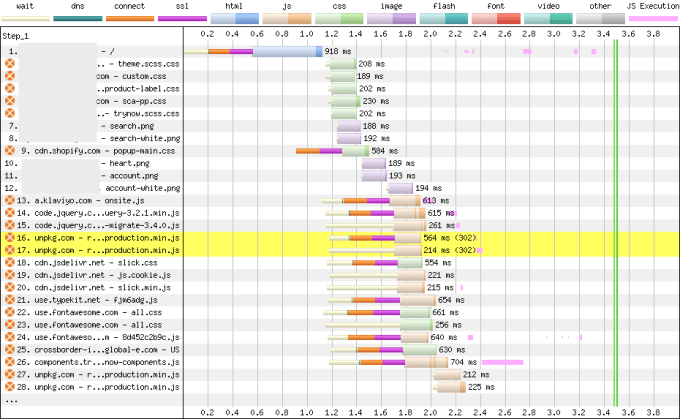
It’s best to limit the number of different domains the browser needs to connect to when loading a page. Host your assets on the Shopify CDN (Content Delivery Network) as much as possible. In some cases where the external domain is unavoidable, you may be able to use the preconnect resource hint to improve speed.
In the performance community, we often call preload a footgun because it’s easy to shoot yourself in the foot with it. You should not preload resources which are already referenced in the HTML file. This is a common misconception. The browser’s preload scanner will already be able to find them quickly.
What it looks like:
I created a bookmarklet to help you quickly see all your preloads and fetchpriorities in one scan. You want to make sure that the list of elements with fetchpriority set to high and preloaded assets are minimal. We generally try to keep both under 2 each, but this is not a hard and fast rule. Always test before and after using a tool like WebPageTest to see which case is fastest.
Preloading is a powerful tool that instructs the browser to download a resource before it knows that it is needed. For example, when setting fonts in a CSS file, the browser will not know that it needs that font until quite late. That font may benefit from a preload.
On the other hand, blanket-applying preloads to any important resource usually leads to bandwidth contention, as too many resources are fighting for the same network resources. This can delay the loading of more important resources which are needed for both FCP and LCP.
Similarly, setting a high fetch priority can help ensure that critical resources are downloaded quickly. However, if too many resources are marked with a high fetch priority, it can confuse the browser's resource prioritization system. If every resource is important, then no resource is important.
Browsers are pretty smart when it comes to prioritizing content needed to render the page. Always test before and after adding a preload or a fetch priority to make sure that it actually improved the loading speed. Moderation is usually best.
One popular pattern in ecommerce is large “mega menus” with hundreds and even thousands of DOM elements. On top of that, instead of using CSS to change the styling on mobile vs desktop, often a website will have 2 versions of the mega menu doubling the number of DOM elements.
What it looks like:
Here’s an example website which has two separate very large mega menus. The mobile nav contains 2,868 DOM nodes and the desktop nav contains 2,223. That’s over 5,000 nodes just for the nav on a page with 6,800 total nodes.
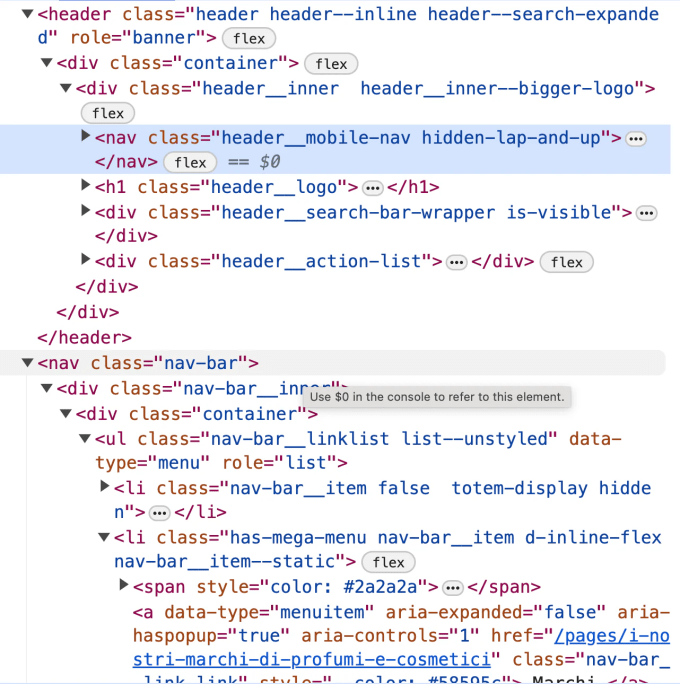
Excessive DOM size is not usually a major culprit when it comes to loading speed except in these cases. If it is an issue for you, it's crucial to simplify the HTML where possible. Some options include:
Lazy loading is a technique where images are loaded only when they are near the viewport. This can improve performance by reducing the amount of data that needs to be loaded when the page is first requested.
However, if the LCP image is lazy loaded, it can significantly delay the LCP metric. This is because the image will not start to load until after the page is rendered and JavaScript can fire the IntersectionObserver.

Shopify sites that lazy load their LCP image have a median LCP that is 1.0 second slower than the eager loaded ones. Read more about lazy loading and its impact on performance.
What it looks like:
<!-- Native lazy loading has a loading="lazy" attribute -->
<img src="photo.jpg" alt="" loading="lazy">

<!-- Lazy loading using a JavaScript library often has a class with
    "lazy" in the name and data-src attributes -->
<img src="placeholder.jpg" data-src="photo.jpg" alt="" class="lazyloaded">Use the new Liquid features of section.index and default lazy loading of the image_tag to vary loading strategies for images above the fold. Learn more about these plus code examples in our article.
A corollary to this is to not use auto-sizes for LCP images. This is a feature of some lazy loading libraries and in the works to be a native web feature. For the browser to be able to download the correct image eagerly, it needs a proper sizes attribute. If you use auto-sizes or the wrong sizes attribute, a new, larger image may be downloaded later, slowing down the LCP. Use the Responsive Image Linter Chrome extension to help you get your sizes right.
What it looks like:
<!-- In the future, native auto sizes will set the sizes
     attribute to "auto" -->
<img src="photo.jpg" alt="" sizes="auto" loading="lazy">

<!-- Today, this is possible using a JavaScript framework which
     often will have a data-sizes attribute set to auto -->
<img src="placeholder.jpg" data-src="photo.jpg" data-sizes="auto" alt="" class="lazyloaded">Transitions, such as fade-ins or other animations, can delay the point at which the browser considers the LCP image to be fully rendered, even if the image itself loads quickly.
What it looks like:
This one is harder to catch. First, if you run WebPageTest, you will see the image finish loading well in advance of the LCP event. This will tell you that something is delaying it, but not what. You’ll have to dig in more to understand if it is something like an anti-flicker snippet or an image transition. Sometimes you can eyeball it to see if you observe a blur up effect, or you can modify the filmstrip settings down to 0.1s to observe it there, as in the screenshot below. You can also use Dev Tools to inspect the image or the image container’s CSS to look for clues such as an opacity property.

opacity and transition properties.Instead of gradually showing the image with a fade-in or blur-in effect, it's better to have the image appear immediately. While animations can add visual appeal, they can also make the user experience feel slower if they delay when the image is shown. Read more about how we helped one merchant Improve Largest Contentful Paint (LCP) by removing image transitions.
When an image is discovered late, the browser doesn't know to start downloading it until after it has finished parsing the CSS or JavaScript that references it. This can delay the loading of the image, causing a slower LCP.
This typically happens in two cases:
What it looks like:
In the mock-up below, you can see that in the case of a late discovered image, each file “chains” off the previous file which is why these are also called critical request chains:
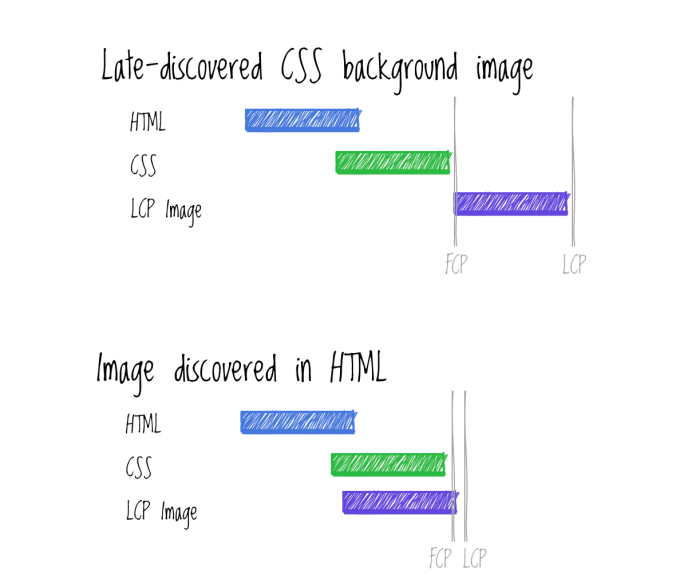
To prevent this, reduce or remove the chain by using the image_tag in Liquid HTML files whenever possible. Favor code that can render what the page initially looks like fully in HTML and CSS, then layer in the dynamic behavior features using JavaScript.
When JavaScript is used to render pages, the browser has to wait for the JavaScript file to be downloaded and executed before it can start rendering the page. This can significantly delay the time it takes for content to appear on the screen.
What it looks like:
Disable JavaScript in your browser, then try loading your website. If all or most of the page does not render, you are likely either using JavaScript for rendering, or you have an anti-flicker snippet enabled.
Similar to other issues listed here, it’s best if you can use an HTML-first strategy for rendering. You can layer in any dynamic features with JavaScript afterwards. Yes, this means that using a frontend JavaScript framework like Vue or React with a Liquid storefront is going to make your site slower. It will also result in a worse INP.
We suggest deferring most JavaScript files, except when that script is needed for rendering, such as when running an A/B test. In these cases, deferring JavaScript would delay the rendering of the page even more.
<!-- Defer non-critical JavaScript -->
<script src="non-critical.js" defer></script>Cookie apps often display a banner or pop-up to inform users about the use of cookies on the site. These cookie pop-ups load late often because they are loaded via JavaScript. If the pop-up becomes the largest element in the viewport when it loads, it could become the LCP element, delaying the LCP event. Consider making the cookie banner smaller than the largest actual website element in the viewport.
What it looks like:

Similarly, newsletter modals and other types of pop-ups that appear before user interaction can become the LCP element and delay the LCP event.
What it looks like:

They often come from a third party or Shopify app and thus load quite late. Modals that ask for a user’s email address before they’ve even seen the page are also a user experience antipattern.
Most apps that offer this service have a setting where you can delay the pop up until after user interaction, such as scrolling. This way, the pop up won't become the LCP element, and the LCP metric will more accurately reflect the loading performance of the page's main content.
Similar to FCP, overusing preloads and fetch priority can impact the LCP element as well. They can lead to bandwidth contention, delaying the loading of more important resources. On the other hand, not setting fetchpriority="high" on the LCP image can result in the browser not prioritizing the download of this critical resource, leading to a slower LCP.
What it looks like:
I created a bookmarklet to help you quickly see all your preloads and fetchpriorities in one scan. You want to make sure that the list of elements with fetchpriority set to high and preloaded assets are minimal. 2 or fewer of each is usually okay, but always test especially if you start going higher.
While preloading resources and setting a high fetch priority can be beneficial, they should be used judiciously. The key is to prioritize the right resources, not all resources.
Now that you know how to identify the performance gaps and find their common causes, you can start optimizing the loading speed of your page in a more strategic way. In this article, you learned about the most common issues we see for each of those performance gaps. It’s not an exhaustive list, but it covers the cases we see most frequently.
Web performance is not easy. It requires understanding various metrics, identifying patterns, and asking the right questions. However, with practice and the right tools and a more efficient process, you can achieve a faster loading speed.
Header photo by Marten Newhall on Unsplash
webperf Shopify images JavaScript analytics external
I'm a freelance performance engineer and web developer, and I'm available for your projects.
Hire me
What are some strategies for serving modern JavaScript to modern browsers?

My most popular content in 2024 was all about the web - from performance to 11ty, hosting, and the Indie Web

Learn the common causes for layout shift on Shopify Liquid storefronts and how to fix them
If you liked this article and think others should read it, please share it.
I just realized this will also help populate the webmentions for old posts too! source
This is such a great article @sia.codes. Thanks for sharing! source
I'm so happy you liked it! source
These are webmentions via the IndieWeb and webmention.io. Mention this post from your site: