
Adding Prettier to a Project
Add Prettier with a pre-commit hook and dedicate one commit to a full reformat
, updated by ![]() Sia Karamalegos
Sia Karamalegos
Discover all JavaScript downloaded and used/unused for a site in a handy data visualization with Lighthouse Treemap.

Lighthouse Treemap is a new tool that helps us evaluate the efficiency of the JavaScript on our websites. It shows us:
JavaScript is often the biggest culprit when it comes to poor web performance. This tool can help us find our biggest dependencies and opportunities for improvement.
In this post, I'll cover:
First, lets understand what a treemap is:
Treemaps display hierarchical (tree-structured) data as a set of nested rectangles. Each branch of the tree is given a rectangle, which is then tiled with smaller rectangles representing sub-branches. A leaf node's rectangle has an area proportional to a specified dimension of the data.
- from Treemapping on Wikipedia
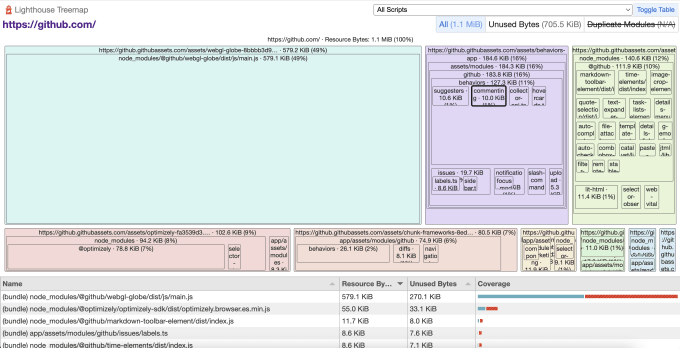
Below is an example Lighthouse Treemap from github.com. It contains 2 sections:
In the treemap section, the size of each rectangle represents the number of bytes for that script. The treemap also shows the actual number of bytes and percent of total bytes. White gaps in the grid separate each file. Rectangles inside the files represent the individual modules in those scripts:
To see module-level data, sourcemaps need to be enabled. This report from trello.com shows what the Lighthouse Treemap looks like without sourcemaps:
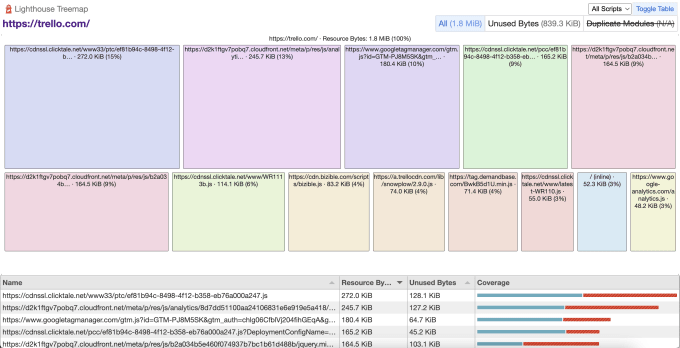
In my experience, I've found reports often are a mixture of the two levels of data. Most third-party scripts will not show modules, and many first-party ones will.
Clicking "Toggle Table" will hide the coverage report and make the treemap larger, revealing more rectangles. We can click on a rectangle to zoom in on it and see its dependencies better. To return, click on the title above the rectangle. Here's a short video demonstrating these actions (and more!):
The Chrome team went one step farther by adding the code coverage report. Underneath the treemap, we can see how much of our JavaScript was actually used on page load, for each file. You can also click "Unused Bytes" in the top right corner of the treemap to see unused bytes on the treemap:
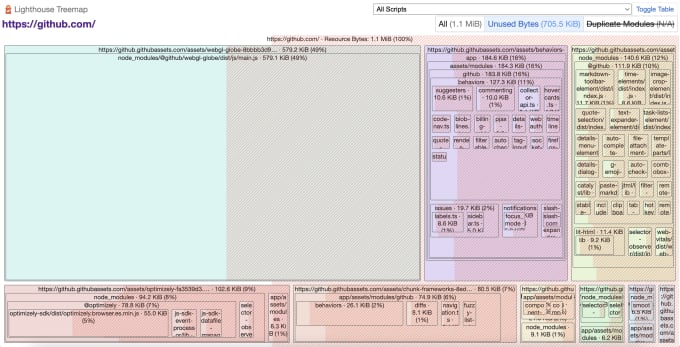
This is pretty slick as deep-diving on the treemap will show unused bytes for each module too.
The Lighthouse Treemap functionality is similar to two existing toolsets. First, the Coverage tool in Chrome is almost the same tool as the bottom part of the treemap. Second, the treemap itself is very similar to bundle analyzers.
The Coverage tool already exists in Chrome Dev Tools. The original tool also lists CSS files and used vs unused CSS bytes. You can interact with the page to see the percent used bytes increase.
To access and use it:
The treemap itself is very similar to bundle analyzers. Webpack-bundle-analyzer is one of my favorites. These tools help you understand the size of all the bundles (and modules) that your application code generates.
I deployed the output in this webpack-bundle-analyzer example so you can interact with it live. Or, you can watch this quick demonstration:
You might have noticed a key difference in what bundle analyzers show you versus Lighthouse Treemap...
Bundle analyzers are great, but they do not show which bundles are loaded and used on your site. The closest tool I've seen that shows this is the Next.js build script output:
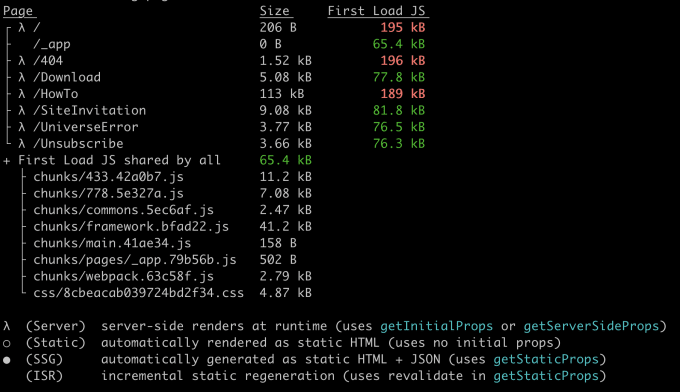
I love how Next.js differentiates the chunks and bytes used for the initial load. This output would be great to pass through a budget tool to prevent commits/PRs from exceeding a target amount of JavaScript.
It is a handy tool, but it doesn't give me much introspection into which modules are the heaviest. I need this knowledge so I can improve or replace large dependencies. Finally, this and other bundle analyzers don't show me any third-party scripts loaded from outside the application code.
Lighthouse Treemap is not a Swiss army knife. You wouldn't want to prepare a gourmet dinner only using the tiny knife tool. Nor open a bottle of wine with the tiny corkscrew if you had a corkscrew dedicated to that job.
Lighthouse Treemap is great for evaluating the JavaScript chunks/files and modules needed for initial load. It visualizes relative sizes so you can quickly see the largest ones. And, you can apply a used/unused filter to find the most inefficient pieces of code.
Now we need to understand a few of its limitations:
While sourcemaps are needed to get the most benefit, even without them I can see which chunks are largest. I can also see how many are core features versus third-party tracking scripts. You can run the dedicated Coverage tool to explore usage as you interact with the page. Your goal isn't 0% unused. Finally, for scripts loaded later, use the Network tab and bundle analyzers.
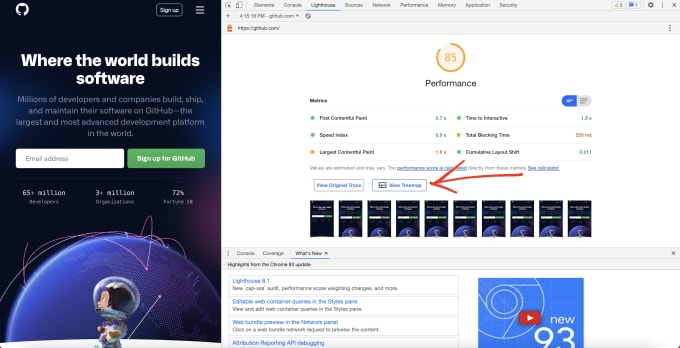
Now that you know all about Lighthouse Treemap, how do you access it? It's now fully released in Lighthouse in Chrome! You can access it through many routes:
Once you have a Lighthouse report (1, 2, or 4 from above), then you'll find the View Treemap button below the metrics:
Lighthouse Treemap is a welcome new tool in the web performance arsenal. It fills a much-needed gap in evaluating the JavaScript downloaded for initial page load. We can see which chunks are the largest, and which modules within those chunks are contributing most to our bundles. Finally, it visualizes how much JavaScript is unused so we can quickly find the worst offenders and take action.
Finally, Lighthouse Treemap helps me evaluate any website from the outside without having to add dependencies like bundle analyzers.
Have you tried out Lighthouse Treemap yet? Has it made measuring performance for your site easier? Let me know in the webmentions!
Don't miss a post. Sign up for my newsletter!
I make websites faster, smarter, and easier to grow.
If you want someone who’s creative and precise, deeply reliable, and not afraid to tell you what’s what to get you to the next level—I’m your partner.
Add Prettier with a pre-commit hook and dedicate one commit to a full reformat

Learn how to grow your tech career by engaging and contributing to tech communities through writing, speaking, open source, and more

What tools are web performance engineers using to measure site speed in 2021?
If you liked this article and think others should read it, please share it.
 15
15
These are webmentions via the IndieWeb and webmention.io. Mention this post from your site: