
14 web performance tips for 2025
Strategic web performance tips that you should be focusing on in 2025 to improve Core Web Vitals
Trying to convince your company to make site load speed improvements? Maybe Google Analytics can help.

Many of us who love the web and want to make it fast feel like we’re shouting out into the ether that performance matters, but I’m not sure anyone is listening. We write articles, give talks, organize whole conferences, and we even have a hashtag (#PerfMatters)! But, many companies still don’t listen. It’s not their fault necessarily.
The business doesn’t care about having a fast site. It cares about making money.
—Elizabeth Sweeny and Paul Irish talking about speed at Google I/O 2019
Businesses see pushing features as the primary activity that will increase revenue. They find it hard to picture themselves in all the stats about companies who have seen bottom-line impacts after improving performance.
We need to reframe the argument in terms of them making money. Not some other company, them. They don’t want to gamble based on some other company’s experience.

This is where Google Analytics (GA) comes in handy. Most businesses already use it, and if they don’t, it’s a quick thing to add. To get the most out of this exercise, you will want to have revenue tracking in your analytics account as well (advanced e-commerce). If you do not have that set up yet, you can still track bounce rates and other metrics by page load speed.
In the rest of this post, I’ll show you how to gather and analyze the data related to load performance so that you can use it to justify work to improve performance.
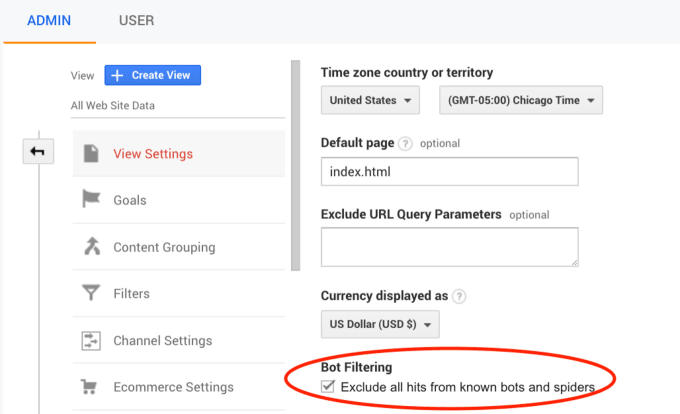
Beware the bots. We want our data to be relevant, and unfortunately, a lot of bots out there access our websites and web applications. First, check to see if you already have bot filtering enabled. Go to Admin > View Settings, and scroll down to find the Bot Filtering setting:
Before you save a filter, preview the changes to make sure you’ll get the desired effects. You can create a test view first.
We already had this setting checked, but by chance, I found that we had nearly 15% of our users coming from bots using AWS data centers:
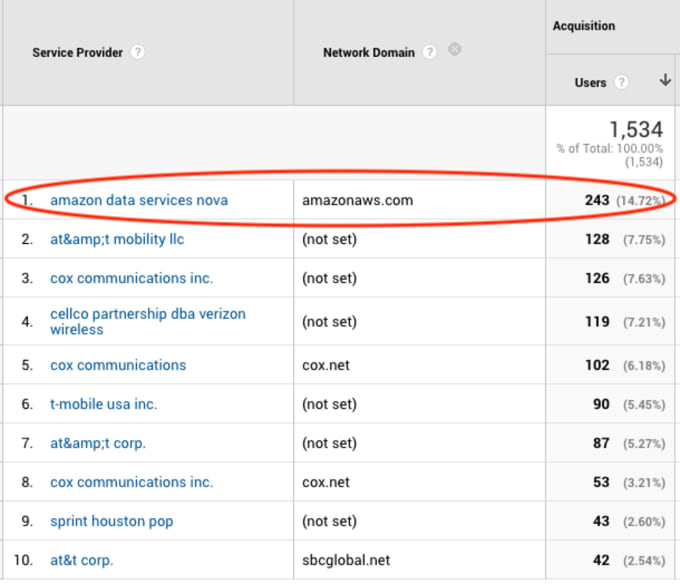
This isn’t good. Go to Technology > Network and see if some variation of “amazon data services” shows up in your Service Provider list. Luckily other people have written about this, so the steps to filter out these kinds of bots are already outlined in this article by GlowMetrics.
By default, only 1% of users will be tracked for speed metrics in Google Analytics. If your business gets a lot of traffic, this sample rate might be fine. If not, you might want to bump it up at least temporarily to both establish a baseline before changes and see the results after.
First, how much data are you getting? Go to Behavior > Site Speed > Overview. You should see a statement like “XX of pageviews sent page load sample”. For us, this wasn’t a high enough number for that time period to effectively bucket page loads later. You can see your page timings buckets by going to Behavior > Site Speed > Page Timings. By default, it puts you in the Explorer tab. Switch over to the Distribution tab, and you will see page load buckets, and how big the sample is, and the distribution for each:

These sample sizes are fine for seeing a simple distribution of page load times, but once we start segmenting those buckets into bounce rates, made a purchase, etc., the sample sizes quickly become too small.
If you determine you need to increase your sample rate, use the siteSpeedSampleRate field when creating your tag (docs):
ga('create', 'UA-XXXX-Y', {'siteSpeedSampleRate': 10});Gather baseline data. A month will give you a more solid baseline not subject to daily variations which might happen in a shorter report of a week or less.
Now that you have some data to work with, let’s dive in and chop it up. Once logged in to your Google Analytics dashboard, go to the Behavior > Site Speed > Page Timings section.

Already, we can see some great data like our average page load time and then buckets of how many users experienced page load times of 0–1 sec, 1–3 sec, 3–7 sec, and so on. By expanding each of these buckets, you can see even finer grained data for each bucket. These smaller buckets vary by size from 0.2 seconds to 2 seconds to 15 seconds as you go into the higher load time brackets.
This is great, but what we’d really like to know is the bounce rate and the rate of users making a purchase for each bucket (or any key performance metric for the company). We can do this with segmenting. Above the chart and tabs, click on the +Add Segment button. Add Bounced Sessions and Made a Purchase (if you have advanced e-commerce enabled) to the segments. If another metric is vital to the business, select that one.
We now have a page-speed-bucketed chart for all views, bounced sessions, and views that resulted in a purchase. The only problem is that the percentages aren’t very useful — they show the percent of total views, not the percent of views in that bucket:

To make our argument, we’re going to need to calculate the bounce and purchase rates within each bucket. For example, in the above screenshot, to calculate the purchase rate for users with a 1–3 second load time, divide 1,987 by 9,205 to give 21.6%. Repeat this for all buckets and for bounce rate.
You can export the top-level data and do this calculation in a spreadsheet. Unfortunately, the export does not include the finer-grained buckets. You would need to manually copy that data over for analysis if desired.
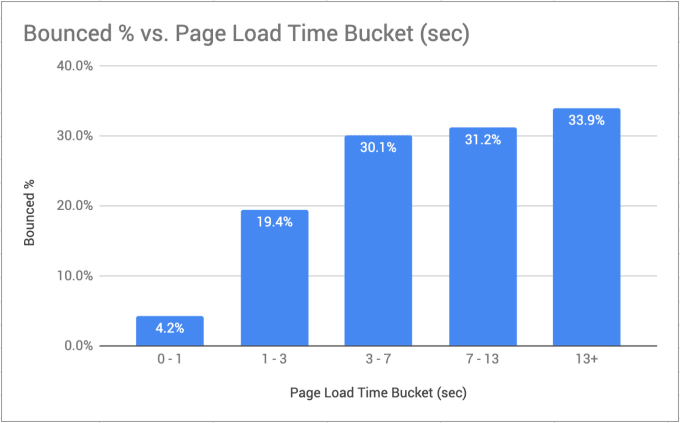
Now we can generate charts to share with the decision makers that show how both purchase rate declines and bounce rate increases as page load time increases for a user:
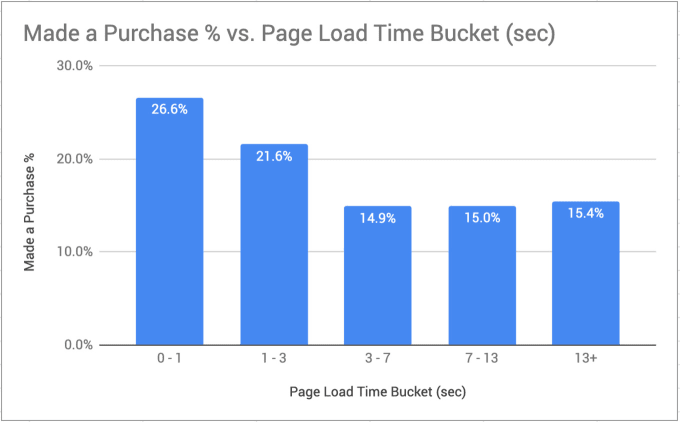
Want to go the extra mile? Calculate theoretically how much more money they might earn if you improve site speed by, say, 1 second. Determine the average revenue per purchase then move each bucket over by 1 second and calculate the difference in total revenue between the two scenarios.
You’ve convinced the company to let you make performance improvements. Congratulations! Now you have to do the real work. Don’t know how to get started? web.dev/fast is a good starting point.

Once you’ve deployed your performance improvements, don’t forget to compare the before and after data for your key business metrics. By preparing analyses like these for our companies, we can better establish ourselves as trusted business partners… and do less work next time we need to convince them to invest in performance, whether that’s page load time, long-running JavaScript, paint, user experience, perceived performance or anything else related to performance.
Do you have a story about convincing your company to invest in performance? I’d love to hear about it!
Thanks to Jad Joubran for reviewing this post!
I make websites faster, smarter, and easier to grow.
If you want someone who’s creative and precise, deeply reliable, and not afraid to tell you what’s what to get you to the next level—I’m your partner.
Strategic web performance tips that you should be focusing on in 2025 to improve Core Web Vitals

Building a site that shows real-user web performance data by Shopify theme using HTTP Archive, the Chrome User Experience Report, BigQuery, Node, and 11ty

A smarter way to break down loading speed problems, identify causes, and implement optimizations
If you liked this article and think others should read it, please share it.
 1
1
These are webmentions via the IndieWeb and webmention.io. Mention this post from your site: