
Justifying performance improvements using Google Analytics
Trying to convince your company to make site load speed improvements? Maybe Google Analytics can help.
Is Lighthouse telling you to eliminate render-blocking resources? Learn what this means, why it's important, and how to fix it in your HTML, CSS, and JavaScript.
, updated by ![]() Sia Karamalegos
Sia Karamalegos

You might be here because Lighthouse told you to "eliminate render-blocking resources". Render-blocking resources are a common hurdle to rendering your page faster. They impact your Web Vitals which now impact your SEO. Slow render times also frustrate your users and can cause them to abandon your page.
I worked with one client to reduce their render-blocking resources and improved their site loading speed. We went from 13% to 80% of page visits experiencing First Contentful Paint (FCP) in less than 1.8 seconds. And we're not done yet!
Understanding render-blocking resources will enable you to fix this common web performance issue. In this post, you will learn:
Before we continue, we need to take a step back and understand what the critical rendering path is.
We write HTML, CSS, and JavaScript in files and then deliver those files to the browser. The browser converts those files into the page you see through the critical rendering path. The steps are:
<link> tag for a stylesheet and download the CSS
We want this process to go as fast as possible. Can you guess what makes it go slower?
Render-blocking resources are files that "press pause" on the critical rendering path. They interrupt one or more of the steps.
HTML is technically render blocking because you need it to create the DOM. Without the HTML we would not even have a page to render.
However, HTML is not usually the cause of our problems...
CSS is render blocking. The browser needs it before it can create the CSSOM, which blocks all later steps. As soon as the browser encounters a stylesheet <link> or <style> tag, it must download and parse the contents. Then it must create the CSSOM before the rest of the render can continue. You can see this represented at the triangle point in the diagram. The render tree cannot continue until both the CSSOM and DOM are created.
JavaScript CAN be render blocking. When the browser encounters a script meant to run synchronously, it will stop DOM creation until the script is finished running:

Additionally, if CSS appears before a script, the script will not be executed until the CSSOM is created. This is because JavaScript can also interact with the CSSOM, and we would not want a race condition between them.

CSS blocks script execution, and JavaScript blocks construction of the DOM! Sounds like a giant mess, right? Stay tuned to learn how we can clean it up!
Render-blocking resources can trigger a cascade of failures for web performance. First paint gets slowed down which causes Largest Contentful Paint (LCP) to be slower. LCP is one of the Core Web Vitals which are now used to calculate your search engine rankings.
SEO is important for discovery of your website. Performance is critical for keeping a visitor on your page. Page abandonment increases significantly if the page doesn't load within 3 seconds. Many companies have seen significant increases in conversions after improving performance.
Vodafone improved their LCP by 31%, resulting in an 8% increase in sales, a 15% increase in their lead to visit rate, and an 11% increase in their cart to visit rate.
WPO stats lists many cases where improving performance resulted in real business impacts.
If you failed this metric in Lighthouse, then you've already discovered one way to test for this. If you're new to Lighthouse, then check out the official Lighthouse page to get started.
We all have render-blocking resources on our sites (all the CSS!). The problem comes in when it significantly impacts our performance. When this occurs, Lighthouse flags it, and we should do something about it.
Lighthouse candidates for render-blocking resources include both scripts and styles:
<script> tags in the <head> which do not have at least one of the following attributes: async, defer, module<link> tags in the <head> without a disabled attribute or a media query which does not match (e.g., print)If you fail this metric, your Lighthouse results will look something like this:
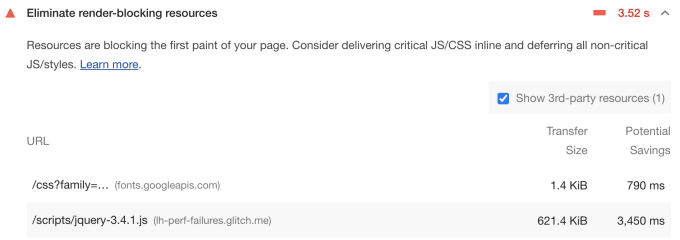
Lighthouse lists the Google Fonts stylesheet followed by a JQuery script. Let's dig in some more. Let's inspect the <head> on that sample failure site. It shows us 3 stylesheets followed by 3 scripts, then 2 more stylesheets:
<head>
  <title>Lighthouse performance audit failures</title>
  <meta charset="utf-8">
  <meta http-equiv="X-UA-Compatible" content="IE=edge">
  <meta name="viewport" content="width=device-width, initial-scale=1">

  <link rel="stylesheet" href="styles/bootstrap-grid.css">
  <link rel="stylesheet" href="styles/bootstrap-reboot.css">
  <link href="https://fonts.googleapis.com/css?family=Roboto:100,100i,300,300i,400,400i,500,500i,700,700i,900,900i" rel="stylesheet">

  <script src="scripts/jquery-3.4.1.js"></script>
  <script src="scripts/bootstrap.js"></script>
  <script src="scripts/bootstrap.bundle.js"></script>

  <link href="styles/main.css" type="text/css" rel="stylesheet" media="screen,print">
  <link href="styles/bootstrap.css" type="text/css" rel="stylesheet" media="screen,print">
</head>
Lighthouse could have flagged any one of those 3 initial stylesheets. The root cause of this failure is:
We're digging a deep hole here.
Another way to test for render-blocking resources is to use WebPageTest. WebPageTest is the next step up in performance profiling. If you enter a URL, it will run a performance test on a real mobile device. Once the test finishes, click on the waterfall for the median run. Every render-blocking resource will have an orange circle with a white X next to its row:
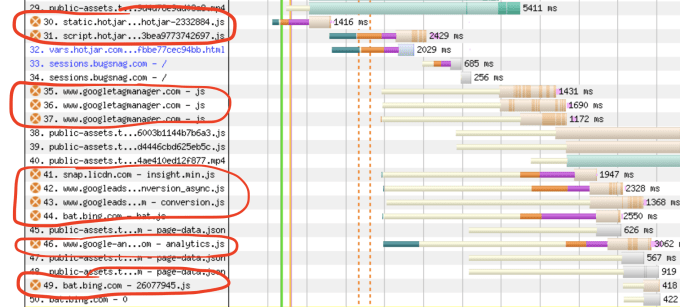
Check out the official WebPageTest docs for more detailed information to get started.
It's time to fill in that hole and fix our website. Let's dive deep into both CSS and JavaScript. Our goal is not to eliminate all render-blocking resources but to lower their impact on performance. The Lighthouse metric is good for determining when you reach that point.
For our CSS, we want to
That sample failure site is great. I need to buy whoever built it a beer. It's so juicy with performance problems. Let's take a step back and observe all the stylesheet tags. We can see that this website is using Bootstrap and a lot of Bootstrap dependencies as well as 12 Google fonts. It also has screen and print styles combined into single CSS files.
The first question I would ask is:
Do I need all those dependencies?
Don't skip that first question. The easiest way to minimize total size for any asset is to annihilate it. Raze it to the ground. For example, 12 Google fonts seems excessive. I try to keep my web fonts down to 3-4 style sets max.
The next easiest way to minimize total CSS is to, well, minimize it. Minification is the process by which a build tool removes unused white space. Fewer characters = smaller size = faster download. If you're using a CSS package, make sure you use the minified version of it. The next step up is to use a build tool to automatically minimize all your CSS. Example tools include Gulp, Grunt, webpack, and Parcel. Snowpack and Vite are interesting newer tools.
Next, I would try to break up my CSS into smaller chunks. Ideally, we only want to deliver the CSS that we will actually use. You can see how much of your CSS (and JavaScript) is actually used with the Coverage drawer in Chrome Dev Tools.
The drawer will open up for you, and you can click the reload button to start a new coverage analysis. Here is an example from the New York Times website:
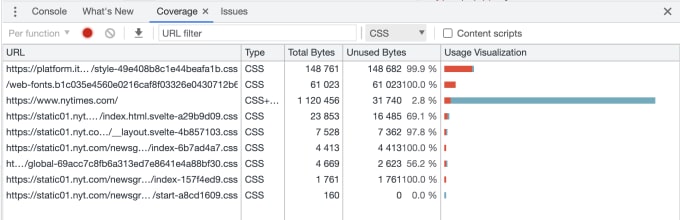
If your total CSS bytes are small, then the unused percentage becomes less important. For example, my home page is around 57% unused. Because my total CSS is small, my Lighthouse scores are still around 97-100.
Note that it's only accurate for the styles (or scripts) used thus far. As you interact or resize the page, those numbers will go up.
Your goal is not necessarily 0% unused. However, if you see big red bars and high unused bytes, it's time to reduce the CSS needed for initial render. Remove dependencies, use code splitting, or inline critical CSS and defer the rest. For those last two options, you definitely want to use a build tool. Check out Extract critical CSS for more details including popular tools.
If you have a lot of non-screen styles, consider extracting them to their own stylesheet. Then use a media query on the <link> tag. For example:
  <link href="styles/main.css" type="text/css" rel="stylesheet" media="screen">
  <!-- Only downloaded for print: -->
  <link href="styles/main_print.css" type="text/css" rel="stylesheet" media="print">
Finally, do not use @import in your stylesheets to load more stylesheets. The browser won't discover it until later. It's best to load them with <link> tags in your HTML.
As I mentioned earlier, JavaScript is parser-blocking. This means that it blocks DOM construction until it is finished executing. Like CSS, we want to:
The Coverage drawer also analyzes your scripts. You can filter the results between CSS and JavaScript. Again, the first question to ask yourself is:
Do I need all those dependencies?
JavaScript is our most expensive asset and prone to bloat. Trim out unused dependencies. Additionally, use code-splitting, tree-shaking, and/or lazy loading features as needed. Your build tool is your friend for all these strategies.
Let's talk about delivering our JavaScript effectively. The best diagram I've seen for understanding async vs defer vs module is from the HTML spec:
Choose wisely. In most cases you will want either defer or async to optimize the critical rendering path. If you have an inline script which must run synchronously, test moving it above your styles in your HTML.
Render-blocking resources can kick off a cascade of performance issues. Those performance issues result in unhappy users who abandon your page faster.
Lighthouse and the Coverage tool can help you identify this issue and evaluate what your best options are. We learned to:
defer, async, or module attribute on our scripts.I'd love to hear what worked for you! Tweet at me with your replies.
Fixing web performance issues can be overwhelming. If you need more help, I'm available for performance consulting projects. Contact me today!
Special thanks to Barry Pollard and Anthony Ricaud for their help with proofreading and editing!
I'm a freelance performance engineer and web developer, and I'm available for your projects.
Hire me
Trying to convince your company to make site load speed improvements? Maybe Google Analytics can help.

If you use Google Fonts, a few additional steps can lead to much faster load times.

What are some strategies for serving modern JavaScript to modern browsers?
If you liked this article and think others should read it, please share it.
Thank you for this. But for many of us Wordpress and it’s plug-ins are the impossible-to-fix problem #wordpress source
There are some existing posts that cover this topic specifically for wordpress - maybe try them out? I do know that a lot of the plugins have a lot of bloat. Profile your site and then try to replace the worst offenders with more performant ones. source
Good article. I really like the diagrams. source
Thanks so much! source
SO GOOD! source
Aw, thanks so much!! source
Amazing job, @TheGreenGreek ! source
Thanks! source
Aww thanks! source
Also mine are probably my eleventy data and webmentions ones plus the render blocking resources one wherever I need to explain it to someone else sia.codes/posts/render-b… source
These are webmentions via the IndieWeb and webmention.io. Mention this post from your site: